
Historical Swell Reports and Spot Statistics
When planning a surf trip, it can be challenging to predict wave conditions for the upcoming months. To gain insight on wave patterns, wind direction, and other key information, it's beneficial to analyze past data. Swellarchive.com is a valuable resource that offers wave and wind information for a wide variety of surf spots around the globe. Our website allows you to easily compare different surf spots for your planned travel period and examine wave patterns for specific locations over the past several years. This is made possible by utilizing archived simulation data from the GFS-Wave model between 1980 and 2025.
Use our website to plan your next surf trip and make the most of the waves! Here you can find a description of the main parts of the website and what the shown data means for the conditions at the beach.
Table of Contents
How-to Guide
Analyse Spot

With Analyse Spot you can find all available data for over a thousand spots around the globe. The content is separated into four sections:
- General Spot Information: Showcases the break's geographical and geological profile (including optimal swell angles, preferred wind directions, seabed makeup like sand or reef), nearby alternative breaks, and current live surf conditions.
- Current 8-Day Surf Forecast: High-resolution atmospheric and marine forecast grids for near-term planning.
- Statistical Data: Aggregated seasonal wind and swell statistics designed to help you identify the ultimate climatological travel window for any spot.
- Historical Surf Forecast: Our oceanographic archive. Step back in time to inspect day-by-day conditions for any month between 1980 and 2025.
Example Spots:
Compare Surf Spots

Our advanced Comparison Tool enables users to cross-analyze up to four surf destinations simultaneously to identify the most consistent option for their target dates:
- Compare live forecast parameters side-by-side in real-time.
- Stack historical monthly reports from over four decades of archives side-by-side.
- Visualize statistical variances in swell height distributions and offshore wind frequencies.
- Evaluate and compare the exact number of statistically surfable days matching your personal performance window.
Diagrams
Surf Report Plot

This comprehensive chronological chart illustrates the daily progression of critical oceanographic metrics for any chosen historical month :
- Swell Height & Wave Period: Swell bars denote height and are color-coded based on their corresponding wave period (ranging from light blue for short-period wind swells to dark blue for powerful, long-period groundswells).
- Wind Speed & Direction: Directional arrows reveal where the wind is blowing from. The size and color-intensity of the arrows map directly to wind velocity.
- Tide: The continuous sinusoidal background line maps the daily ebb and flow, indicating high and low water marks.
Wind & Wave Rose Plots
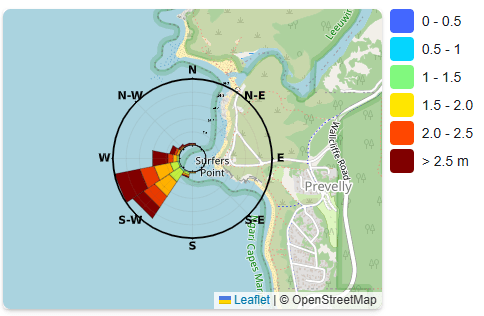
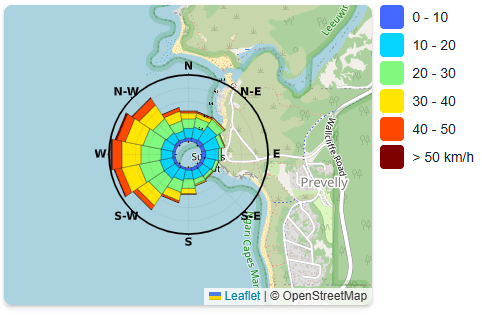
Our directional rose plots offer a highly condensed, spatial summary of the meteorological and wave climate at a specific beach :
- Wave Height: Radial segments extend outward from the center. The length of each segment signifies the average wave height of swells originating from that specific compass bearing.
- Wave Direction: Each segment aligns with a compass coordinate, allowing you to instantly identify the spot's primary swell window by finding the longest radial line.
Monthly Wind Conditions

A clean, diagnostic bar chart displaying the average wind quality for all 12 months of the year, categorized into "Good Wind" (offshore or light) and "Bad Wind" (onshore or strong). This is the ultimate tool for narrowing down your seasonal travel window.
Monthly Swell Conditions

This bar chart breaks down the monthly composition of incoming wave energy into three physical classes :
- Wind Swell (Green): Locally generated, short-period waves. Characterized by disorganized, choppy surfaces; best suited for bodyboarding, casual groveling, or surf schools.
- Ground Swell (Blue): Organized, long-period waves generated by distant deep-ocean cyclonic systems. These waves travel thousands of miles, consolidating into clean, powerful sets ideal for high-performance surfing.
- No Swell (Gray): Periods of flat or minimal wave activity, making them perfect for Stand-Up Paddleboarding (SUP) or snorkeling.
Wave Physics & Oceanographic Glossary
To extract the maximum value from our statistics, it is vital to understand the fundamental physics of the ocean :
- Significant Wave Height SwellArchive utilizes the scientifically standardized metric of Significant Wave Height (), which is mathematically defined as four times the square root of the zeroth moment of the wave variance spectrum: . Historically, this metric represents the average height of the highest one-third of waves in a measured sea state, aligning closely with visual estimates made by experienced mariners.
- Wave Period The time interval (measured in seconds) required for two consecutive wave crests to pass a fixed point in space. Long-period swells () contain exponentially more kinetic energy, travel faster, feel the ocean floor in deeper water, and produce much cleaner, larger, and more hollow waves upon breaking.
- Swell Direction The true compass heading (0° = North, 180° = South) from which the dominant swell propagates toward the coast. Even a minor shift in degrees can dictate whether a swell successfully wraps into a protected pointbreak or gets blocked by offshore islands.
- Wind Speed & Direction
- Speed: Expressed in knots (kt), meters per second (m/s), or miles per hour (mph).
- Direction: The compass direction from which the wind blows. For surfing, light and offshore winds (blowing from the land out to sea) are highly coveted as they groom the face of the wave, delaying its break and creating hollow barrel sections.
- Surf Consistency The statistical percentage of days within a given timeframe where wave heights and wind directions meet or exceed the minimum surfable parameters at a specific location.
Scientific Data Sources
We utilize high-resolution archived global models for historical wave and wind statistics:
- WAVEWATCH III® Production Hindcast, Multigrid (Feb 2005 – May 2019)
- WAVEWATCH III® 30-year Hindcast Phase 2
- NCEP GFS 0.25 Degree Global Forecast Grids Historical Archive – NOAA/NCEP (Updated daily)
- E.U. Copernicus Marine Service Information – Global Ocean Waves Reanalysis
- Copernicus Climate Change Service, Climate Data Store - ERA5 hourly data on single levels from 1940 to present.