Map
Map
Avalanche
Today's Surf Conditions at Avalanche
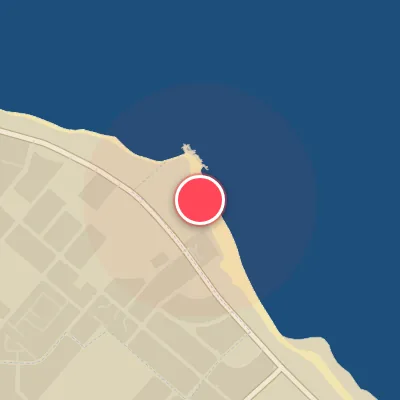
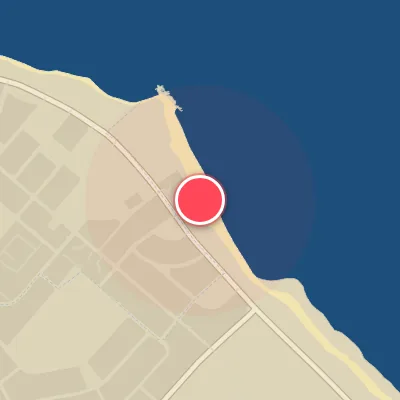
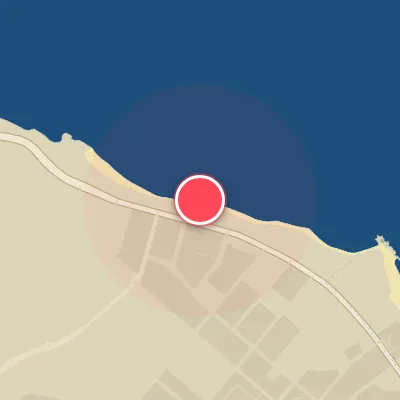
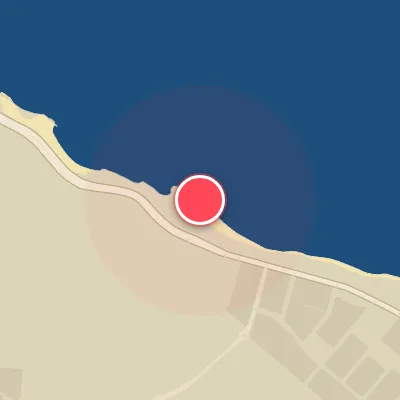
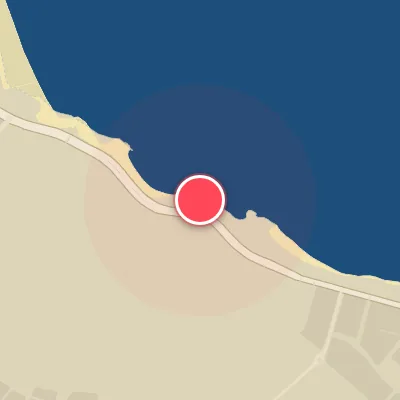
Spot Conditions Map
Hover over the hourly chart columns to update the wind & swell direction overlays on the map.
Today's Surf & Wind Forecast (Hourly)
Loading forecast text...
Spot Overview & Description
Avalanche at St Francis Bay anchors the north end of Pollock Beach, squarely in the heart of Summerstrand. This reef-and-sand-bottom right-hander draws a dedicated local crew and a solid traveling pack, especially when the south-east swells pulse. The beach offers full amenities—parking, facilities, easy access—so you can settle in for a full day of surfing. Avalanche comes alive with south-east groundswell, though east and south-west directions can also deliver. It handles swell in the 3-foot range (about 0.9 meters), breaking over a mix of rock ledge and sand. The wave is a fast, right-hand reef break suited to intermediate surfers who can navigate a tight takeoff zone and read the shifting lineup across all tides—low, mid, and high. Best sessions align with south-west winds that groom the faces and keep the wave from closing out. Consistency is a strength here, but so is the crowd. When conditions line up, the lineup gets thick. Expect company and pack your patience along with your board. Check the local surf report before you go—Avalanche rewards those who time the tide and wind right, offering punchy, fun rights that make the fight for waves worthwhile.
Best Surf Season & Climatology
Best Surf Season (June - August)
The Southern Ocean roars to life during the austral winter, sending powerful, long-period groundswells marching toward the Western Cape. June through August sees the highest average wave heights (2.3-2.4m) and periods (12.2-12.5s), dominated by SSW and SW swell – directions that wrap into Avalanche's NNE-facing beach. However, this raw power comes at a cost: offshore wind (S through WSW) blows only 18-21% of the time, with frequent E to NE onshore flows messing up the lineup. When a strong winter low-pressure system aligns with a brief southerly wind, the result is pumping, heavy waves with clean faces – the kind that make the long paddle worth it.
Fair Surf Season (April - May, September - November)
The shoulder seasons offer a compromise between size and cleanliness. In April and May, average swell holds at 2.1-2.2m with periods creeping toward 12s, while ideal wind percentages improve to 23-25%. September to November sees similar dimensions (2.1-2.3m, 10.8-11.7s) and offshore wind frequencies around 22-25%. These months are transitional: the Southern Ocean is still active, but high-pressure systems are less dominant, allowing more S-SW wind days. The waves are often fun, solid, and rippable, especially when a passing cold front delivers a clean, glassy window. You won't score the biggest sets, but you'll find more rideable, groomed lines.
Low Surf Season (December - March)
The summer months bring the most consistent offshore wind conditions (28% ideal – the highest of the year), with wind blowing steadily from the S to SW quadrant. Unfortunately, this coincides with the lowest average swell heights (1.9-2.0m) and shortest periods (10.7-11.4s). The predominant SSW and SW swells are still present, but they lack the power and period to generate real punch. December through March is the 'micro season' at Avalanche: you'll often find clean, groomed 1-1.5m waves – fun-sized and groveling – but don't expect any pumping, heavy days. Light offshore winds morning and evening can make for a pleasant surf session, but the lack of any north quadrant swell keeps the spot from firing.
Detailed Surf Information for Avalanche
Detailed Surf Forecast
Access our detailed 8-day swell and wind forecast charts for Avalanche with tidal graphs, period ranges, and daily forecast text summaries.
Swell & Wind Statistics
Explore historical swell consistency, wave heights, and offshore wind windows month-by-month, compiled from over 40 years of data.
Historical Surf Report
Browse the historical database archives to view past wave reports and understand spot climatology during specific years and months.