Map
Map
Gold Beach
Today's Surf Conditions at Gold Beach
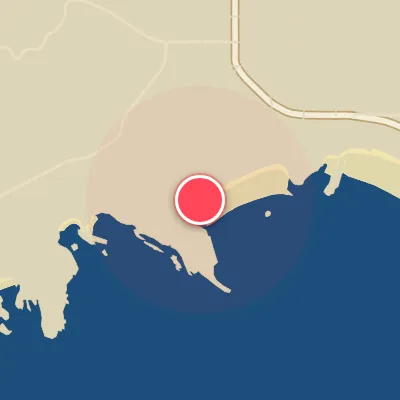
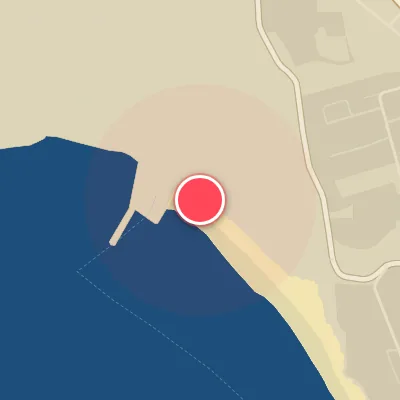
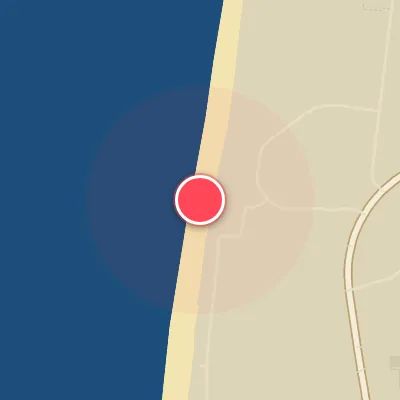
Spot Conditions Map
Hover over the hourly chart columns to update the wind & swell direction overlays on the map.
Today's Surf & Wind Forecast (Hourly)
Loading forecast text...
Spot Overview & Description
Gold Beach stretches out as a lengthy, exposed beachbreak where the Rogue River meets the ocean. The short south jetty offers a bit of shelter from north wind, sculpting both rights and lefts over shifting sand. When the stars align, it can deliver some enjoyable, if fleeting, rides. But this is a fickle stretch—heavy currents, relentless shorepound, and a notable seal population keep things interesting. The region is also home to sharks, with recent encounters reported, and keep an eye out for renegade windsurfers carving through the lineup.
Best Surf Season & Climatology
Best Surf Season (October - March)
The North Pacific roars to life during the fall and winter months, delivering consistent, powerful swell to Gold Beach. With average swell heights ranging from 2.0m in October to a peak of 2.7m in January and December, and wave periods averaging 12+ seconds, these months produce firing conditions. The dominant swell directions are from the W, WSW, and WNW, with a healthy contribution from SW and SSW — all of which hit the beach's west-southwest exposure perfectly. Winds are most favorable during this period, with ideal offshore flow from the NNE through E occurring 26-30% of the time. The combination of long-period groundswell and clean offshore winds when synoptic patterns align makes this the prime window for Gold Beach.
Fair Surf Season (April & September)
April and September serve as transitional months. April still sees an average swell height of 2.1m with periods around 11.7s, but the wind becomes more challenging as N winds increase and ideal wind percentages drop to 19%. Swell directions shift slightly more toward WNW and NW. September sees a rebound with average swell at 1.6m, period 10.8s, and ideal wind at 25% as the fall transition begins. Both months offer occasional windows of good conditions, especially when a strong low-pressure system generates a clean W swell and a high-pressure ridge brings offshore easterly winds.
Low Surf Season (May - August)
The summer months are the leanest for Gold Beach. Average swell heights drop to 1.4-1.7m and periods shorten to 9-11s, indicating a dominance of shorter-period windswell. Swell directions shift predominantly to NW and NNW, which are far from optimal for the WSW-facing beach. Meanwhile, the wind regime becomes dominated by strong N winds — 50.9% of all wind in July is from the north — but these are not true offshore (NNE-ESE) and often create cross-shore or onshore conditions. Ideal wind percentages bottom out at 13% in July. While occasional south swells from distant storms can sneak in, the overall quality is low, making this a time to be selective or explore other breaks.
Detailed Surf Information for Gold Beach
Detailed Surf Forecast
Access our detailed 8-day swell and wind forecast charts for Gold Beach with tidal graphs, period ranges, and daily forecast text summaries.
Swell & Wind Statistics
Explore historical swell consistency, wave heights, and offshore wind windows month-by-month, compiled from over 40 years of data.
Historical Surf Report
Browse the historical database archives to view past wave reports and understand spot climatology during specific years and months.