Today's Surf Conditions at Stockton
Spot Overview & Description
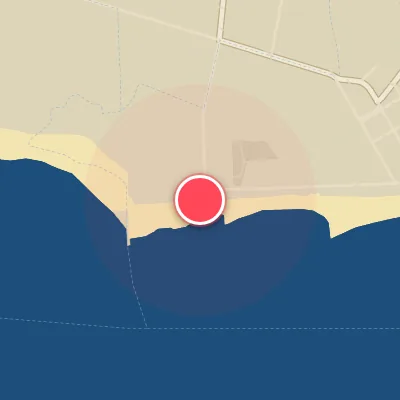
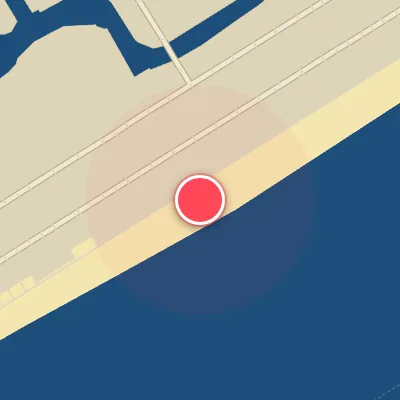
South-facing Stockton is the standout among Cape May’s southern exposures, a steady performer when others struggle for shape. The main attraction here is Stockton Lefts, peeling off a rock jetty over a shifting sand bottom. When the sandbar is cooperating—and that’s a big when these days—the lefts offer playful walls and short, punchy rides that can surprise. Recent beach replenishment has added volatility to the equation, making the sandbars more hit-or-miss than in years past. Best on a south swell with light northwest winds, and on a pushing tide to coax the jetty’s lines into form. Intermediate and advanced surfers will find the most reward, but beginners can still score if conditions align.
Best Surf Season & Climatology
Best Surf Season (October - March)
The surf year at Stockton is all about timing. Because the beach faces south, this stretch of coast depends on S, SSE and SE swell to wrap in, and those directions peak in energy from October through March. Average wave heights sit around 2.3ft (0.7m) with periods in the 6-8s range, but the real story is the wind. The US East Coast's cold season delivers repeated frontal passages that flip winds to NNW, NW and N, producing clean offshore conditions at a south-facing break. When a strong coastal storm tracks offshore and generates long-period S/SE groundswell while the wind goes NW, Stockton can actually pump in the 5-8ft (1.5-2.5m) range for a day or two. The NAO also plays a role: when it turns negative, the storm track shifts farther south, favoring S/SE fetch toward this coastline.
Detailed Surf Information for Stockton
Detailed Surf Forecast
Access our detailed 8-day swell and wind forecast charts for Stockton with tidal graphs, period ranges, and daily forecast text summaries.
Swell & Wind Statistics
Explore historical swell consistency, wave heights, and offshore wind windows month-by-month, compiled from over 40 years of data.
Historical Surf Report
Browse the historical database archives to view past wave reports and understand spot climatology during specific years and months.