Map
Map
Chatarra
Today's Surf Conditions at Chatarra
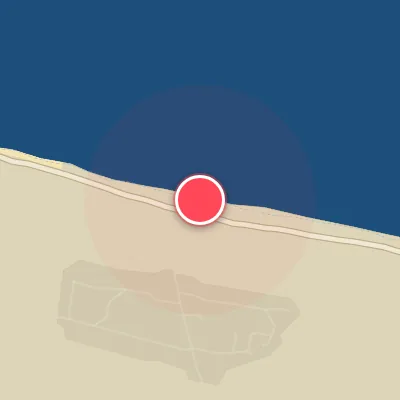
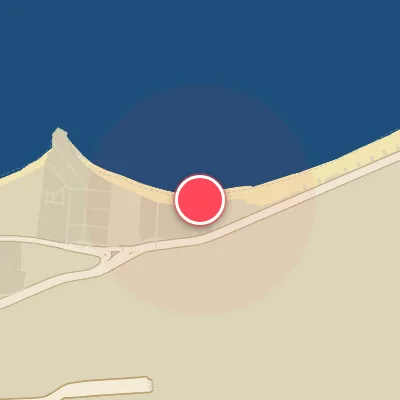
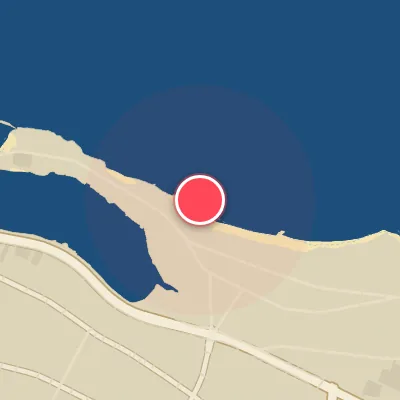
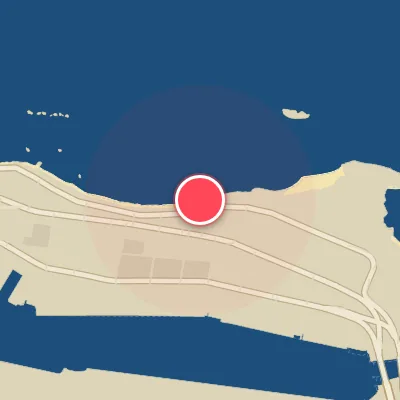
Spot Conditions Map
Hover over the hourly chart columns to update the wind & swell direction overlays on the map.
Today's Surf & Wind Forecast (Hourly)
Loading forecast text...
Spot Overview & Description
Chatarra stands as one of the Caribbean’s more distinguished left-hand setups, a reef-loaded gem that, when the stars align, delivers some of the island’s most pulse-quickening sessions. This flat-ledge reef channel—hungry for a northwest swell—unfolds into powerful, barreling lefts that are as exhilarating as they are humbling. It’s a spot that demands respect and a bit of patience: you’ll need a decent pulse, typically ranging from 4 to 10 feet (1.2 to 3 meters), to truly bring it to life. When a north swell filters in, the wave can morph into a thorny A-frame, but those shallow, sketchy sections keep even seasoned surfers on high alert. Early mornings are your golden window, especially when the wind settles in from the southeast to southwest—that subtle offshore angle grooms the lefts into clean, rideable walls. But be warned: the paddle out is a grunt-worthy workout, and the lineup gets thick when it’s firing, with a pronounced local atmosphere that whispers ‘show respect or stay ashore.’ Access is refreshingly simple—park right by the water—though the best swells come with patience: chase tropical cyclone pulses in late summer and fall, or bank on winter’s more predictable groundswells for consistency. This is no beginner’s playground; Chatarra is for the experienced surfer hunting a raw, challenging ride that rewards nerve and skill in equal measure. Keep your head on a swivel, mind the local currents, and savor every drop.
Best Surf Season & Climatology
Best Surf Season (May - June & September - October)
Chatarra's surf year is a tale of consistent, yet marginal, conditions driven primarily by the easterly trade winds. The best windows occur in late spring and early fall when the trade wind regime relaxes, and the percentage of ideal offshore wind (from the S, SSW, SW) peaks. In May and June, ideal wind tops 39-43%, and while the dominant swell remains small and short-period from the E/ESE, the lighter or southerly winds can groom the waves into clean, fun-sized lines. September and October offer a similar reprieve, with October reaching 40% ideal wind and a slight uptick in swell consistency. These are the months to watch for the rare combo of sunshine and rideable surf.
Fair Surf Season (March - April & November)
March through April and November fall into the 'fair' category, with ideal wind percentages ranging from 26-32%. The trade winds are a bit more active, often blowing side-shore from the east, which can create bumpy, choppy surfaces. Swell heights remain in the 0.5-1m range with a short 6-second period, making for a groveling session at best. Still, there are occasional days when a stronger high-pressure system shifts the wind to the south, offering brief windows of quality.
Low Surf Season (January - February, July - August, December)
The low season is marked by the highest onshore wind frequency and the lowest ideal wind percentages, especially in December (20%), July (21%), and January (24%). During these months, the trade winds are dominant and often stronger, blowing onshore from the N to ENE quadrants. Combined with a persistent low-energy swell from the east, conditions are typically choppy, messy, and small. July and August, despite being summer, are particularly poor due to the strengthening of the trade winds and the complete absence of any north swell. Winter months (Dec-Feb) suffer from similar wind issues, though the swell occasionally pulses slightly higher, still failing to deliver quality waves due to the wrong direction and short period.
Detailed Surf Information for Chatarra
Detailed Surf Forecast
Access our detailed 8-day swell and wind forecast charts for Chatarra with tidal graphs, period ranges, and daily forecast text summaries.
Swell & Wind Statistics
Explore historical swell consistency, wave heights, and offshore wind windows month-by-month, compiled from over 40 years of data.
Historical Surf Report
Browse the historical database archives to view past wave reports and understand spot climatology during specific years and months.