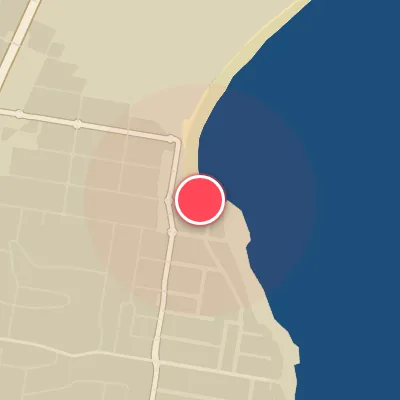
Map
Map
Cronulla
Today's Surf Conditions at Cronulla
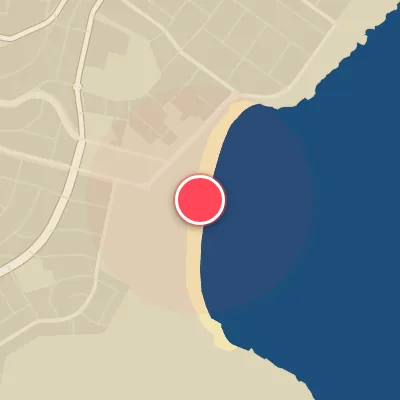
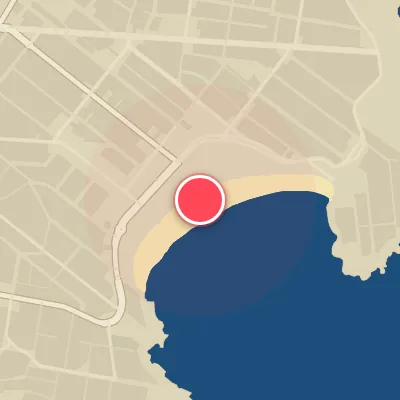
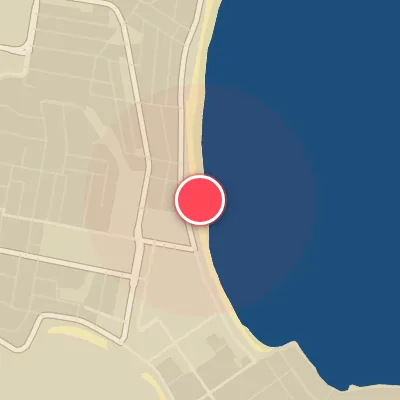
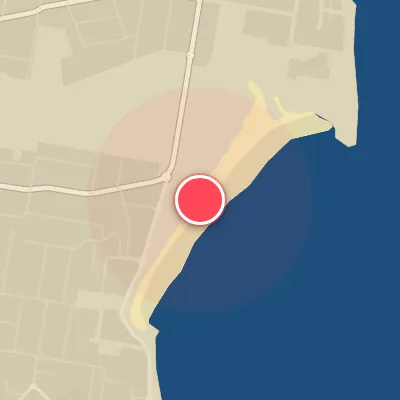
Spot Conditions Map
Hover over the hourly chart columns to update the wind & swell direction overlays on the map.
Today's Surf & Wind Forecast (Hourly)
Loading forecast text...
Spot Overview & Description
Nestled along the southern Sydney coastline, Cronulla Point is a storied right-hand point break that commands respect and draws a dedicated crowd. When conditions align, this reef-lined stretch produces long, reeling walls that can barrel with authority—especially when a solid south or southeast swell fills in. The wave here is at its most potent around 4 feet, where the sudden depth change over an uneven reef sets up a thick, powerful face that demands sharp reflexes and experience. A clean southwest wind is essential to groom the surface, keeping things smooth as the wave bends around the point. While smaller northeast or east swells can produce a more hollow—if less powerful—ride, the true character of Cronulla Point emerges when the swell pushes past double-overhead. At that size, the break becomes a serious proposition for experts only, with fast, pitching sections and a shallow reef that leaves little room for error. Tides are forgiving: low, mid, or high all work, though the wave’s shape and speed shift with the water level. The lineup, especially on a quality day, is notoriously packed with a mix of savvy locals and visiting chargers who know every rock and rip. Expect a competitive, no-nonsense atmosphere where wave count is earned, not given. Cronulla Point delivers world-class right-handers when it fires, but it’s a spot that asks for skill, awareness, and a healthy dose of respect.
Best Surf Season & Climatology
Best Surf Season (May - August)
Winter takes the crown at Cronulla, driven by a reliable procession of high-pressure systems that deliver consistent westerly winds. Offshore flow from the SW, WSW, W, and WNW dominates during these months, with ideal wind frequencies peaking at 40% in July. The average swell period climbs into the 9.5-9.7s range, bringing long-period punch and power. While the dominant swell direction shifts to the southeast and south – a consequence of intensified mid-latitude lows – the east-facing beach still picks up plenty of energy from the south quadrant, and when the rare NE-ESE groundswell lines up under the offshore breeze, it's game on. The average height sits near 1.7-1.8m, offering plenty of rippable to pumping waves.
Fair Surf Season (March - April & September - October)
These transition months present a trade-off. In March and April, the ocean still holds onto summer's east-dominant swell regime – optimal directions NE-ESE account for 38-47% of the total – but the wind patterns begin to shift. Offshore winds become more frequent (17-28%), and the average period rises from 9.2 to 9.4s, improving wave quality. September and October see a similar pattern: the first winter storms are fading, but westerly winds still blow 21-31% of the time, and the swell mix includes both lingering southeast swells and building north-east trade wind energy. These months offer a solid chance for clean, fun waves, especially when a high-pressure system locks in a run of offshore days.
Low Surf Season (November - February)
Summer brings the highest percentage of optimal east swell (NE-ESE often exceeding 50% of the total), but it comes at a cost: onshore winds from the northeast quadrant dominate. Ideal offshore wind frequencies plummet to 10-15% from December through February. The average wave period drops to 8.3-8.4s, meaning short-period, choppy conditions even when the swell size is fun-sized (1.5-1.6m). Afternoon sea breezes are the norm, quickly ruining the morning glass. The rare synoptic setup – a tropical low or an early-season cold front – can deliver a few days of offshore flow, but consistency is lacking. November and December offer a slight uptick in swell energy compared to the deep summer, but the wind remains the primary antagonist.
Detailed Surf Information for Cronulla
Detailed Surf Forecast
Access our detailed 8-day swell and wind forecast charts for Cronulla with tidal graphs, period ranges, and daily forecast text summaries.
Swell & Wind Statistics
Explore historical swell consistency, wave heights, and offshore wind windows month-by-month, compiled from over 40 years of data.
Historical Surf Report
Browse the historical database archives to view past wave reports and understand spot climatology during specific years and months.