Map
Map
Dee Why Point
Today's Surf Conditions at Dee Why Point
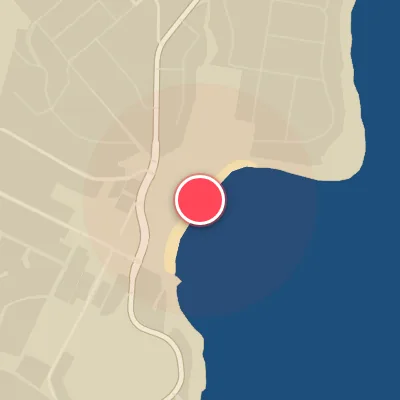
Spot Conditions Map
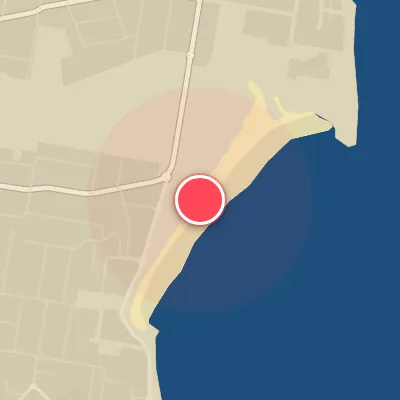
Hover over the hourly chart columns to update the wind & swell direction overlays on the map.
Today's Surf & Wind Forecast (Hourly)
Loading forecast text...
Spot Overview & Description
Slotted into Sydney’s northern beaches, Dee Why Point stands as a technical right-hand reef break that commands respect. Its defining feature—a prominent rock ledge—sculpts the wave into a fast, critical wall that rewards precision and punishes hesitation. The break truly comes alive under a south swell, with south-west winds cleaning up the face; mid-tide offers the most consistent shape and length, though the wave can handle building swell from 4 feet (1.2 meters) upward. This is not a beginner’s playground—the takeoff is shallow, the line tight, and the crowd dynamic intense, especially when it’s firing. Localism runs heavy here, amplified by a mix of seasoned regulars and visiting chargers all jockeying for position. The upside: conditions are easily scoped from the headland or carpark before you commit to paid parking. For variety, Dee Why Beach’s beach breaks hold more size when the point closes out, and a mellower zone known as Kiddies Corner, tucked behind the ocean pool, offers a forgiving option for families and less experienced surfers—just be ready to navigate a territorial undercurrent out on the point.
Best Surf Season & Climatology
Best Surf Season (May - August)
This is when the winter engine of the Tasman Sea really kicks into gear. High-latitude low-pressure systems deepen off the southeast coast of Australia, firing up long-period S to SSE swells that wrap beautifully into Dee Why Point. Simultaneously, the offshore wind window widens dramatically: with more than 44% of the time seeing clean W to SW flow (ideal for this east-facing setup), the point often delivers groomed, powerful waves. Periods average 9.5-9.7 seconds, pushing the swell into the 'punchy to powerful' range, and heights sit consistently in the 1.5-2.5m range – solid, rippable, and at times truly pumping. Late autumn and winter are the prime, no doubt about it.
Fair Surf Season (March, April, September, October)
As the transition seasons set in, the climate patterns become more fickle. The subtropical ridge starts shifting, and the frequency of strong southerly swells begins to ebb or ramp up. March and April still see a decent share of S/SE swell, and wind quality improves as the months progress – April hits 33% ideal wind – so you can still score clean, fun waves on the right days. September and October bring the first southern spring storms, but also more interference from weakening summer patterns. Swell heights hold up around 1.6-1.7m, but the periods dip slightly compared to winter. When a south swell lines up with a land-based westerly, the point still turns on, but you will have to pick your windows carefully.
Low Surf Season (November - February)
Summer snuffs out the long-period groundswells. The south swell corridor goes quiet as the storm tracks retreat toward Antarctica, and the dominant swell shifts to short-period, choppy E and NE pulses generated by local sea breezes and tropical easterly trades. Periods average only 8.3-8.8 seconds, resulting in weak, crumbly waves unless a cyclone wanders south. Even worse, the onshore winds rule – NE to E breezes spoil the surface more than 85% of the time, making conditions sloppy and bumpy. Ideal offshore flow from the west drops to just 12-15%. A few fleeting windows open when a ridge builds offshore, but for the most part, this is the time to schedule gear repairs and wait for autumn.
Detailed Surf Information for Dee Why Point
Detailed Surf Forecast
Access our detailed 8-day swell and wind forecast charts for Dee Why Point with tidal graphs, period ranges, and daily forecast text summaries.
Swell & Wind Statistics
Explore historical swell consistency, wave heights, and offshore wind windows month-by-month, compiled from over 40 years of data.
Historical Surf Report
Browse the historical database archives to view past wave reports and understand spot climatology during specific years and months.