Map
Map
Sandy Beach
Today's Surf Conditions at Sandy Beach
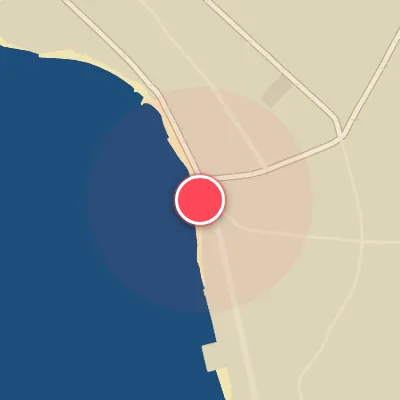
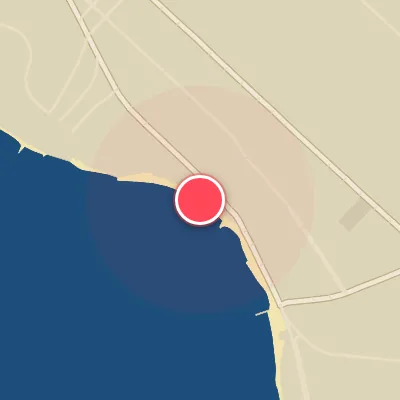
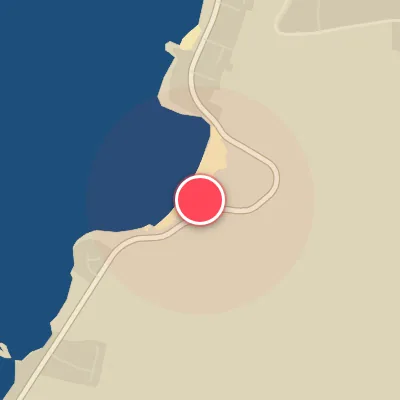
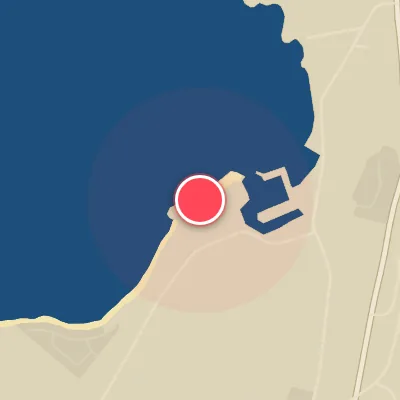
Spot Conditions Map
Hover over the hourly chart columns to update the wind & swell direction overlays on the map.
Today's Surf & Wind Forecast (Hourly)
Loading forecast text...
Spot Overview & Description
Sandy Beach delivers a raw, high-intensity beach break that demands respect. The wave peels over a sand bottom, offering both lefts and rights, but make no mistake—this is a heavy shorebreak built for seasoned experts only. On the outside, a shallow left reef provides a more structured option for board riders, though it rarely shines clean, as the persistent trade winds tend to spoil the shape early on.
Best Surf Season & Climatology
Best Surf Season (December - February)
The heart of winter delivers the most consistent swell energy to Sandy Beach, with average heights hovering around 1.7m and long-period groundswells in the 12-second range. However, the predominant ENE trade winds often blast the surface, making for bumpy, onshore conditions. The real magic happens during brief windows when cold fronts push through, switching winds offshore from the N to NW quadrant. These setups can groom powerful NW and NNW swell lines into clean, peeling walls. It's a game of patience – check the early mornings and post-frontal windows for the best chance at firing surf.
Fair Surf Season (March, April, October, November)
During these transition months, the North Pacific storm track weakens or is just ramping up, and the trade wind regime relaxes slightly. Average swell sizes drop to 1.5-1.6m with periods of 11-12s. The window for offshore winds shrinks to 8-13% of the time, but when a ridge sets up to the north, the onset of northwesterly flow can still carve up solid swell lines. April and October see an uptick in south quadrant swells (SSW-SW), which are the most direct for Sandy's southeast exposure – a rare but rewarding treat when they align with light offshore breezes.
Low Surf Season (May - September)
Summer slams the brakes on quality surf at Sandy Beach. The trade winds become relentless, blowing from the ENE 60-87% of the time, often at 20-40 kph, shredding any chance of clean wave faces. Swell heights average a modest 1.4-1.5m, but the energy comes overwhelmingly from the east and northeast – angles that wrap in poorly and produce short, lumpy lines. South swells, though occasionally present, are small and far between. This is the season for groveling boards and early morning sessions before the onshore wind kicks in, but overall, expect flat to messy conditions.
Detailed Surf Information for Sandy Beach
Detailed Surf Forecast
Access our detailed 8-day swell and wind forecast charts for Sandy Beach with tidal graphs, period ranges, and daily forecast text summaries.
Swell & Wind Statistics
Explore historical swell consistency, wave heights, and offshore wind windows month-by-month, compiled from over 40 years of data.
Historical Surf Report
Browse the historical database archives to view past wave reports and understand spot climatology during specific years and months.